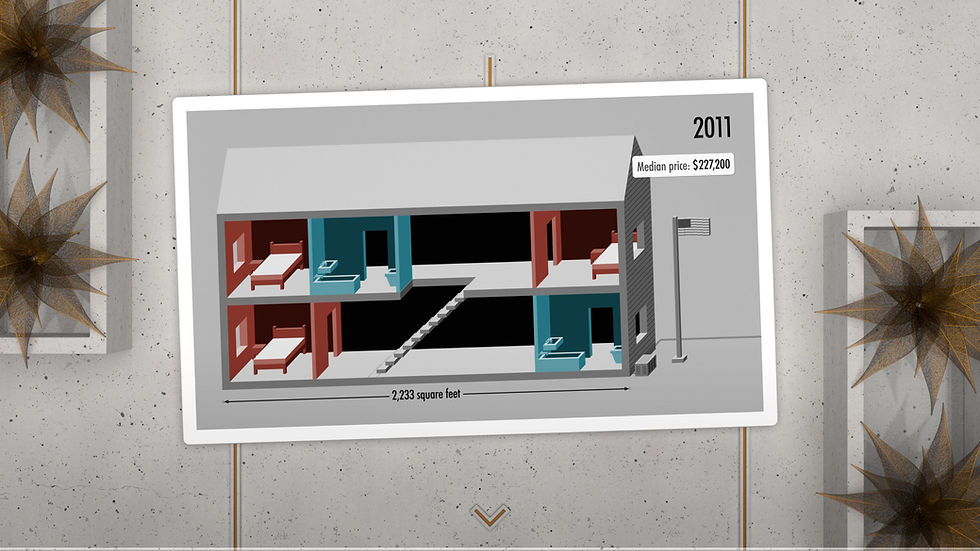
Featured on FastCo.Design, Curbed, and Good Housekeeping, this animated visualization for CNNMoney shows the evolution of new single-family homes in America over the last 40 years. Reflecting data from the U.S. Department of Housing and Urban Development, and the U.S. Department of Commerce, the square footage of the median house increases, while various features change. Narration by Andrew Bergmann.
I originally conceived this as a 3/4 view visualization (first image below), optimizing the isometric perspective, but we decided a straight-on view would more clearly show the changing interior details. The final result is less obviously isometric, but I riffed on the blockiness suggested by the original grid floor and came up with an American flag made of cubes — even the smoke coming out of the chimney (when present) is cubistic in nature.


Though it may seem counter-intuitive, this piece was not created in 3D. It's a modular 2D drawing shifting around based on some crazy math — and by "crazy math," I mean very rudimentary math that I was able to cobble together with quite a bit of difficulty and patience.
For more stuff like this, go to the visualization page.